Sprint Burn Down
The sprint burndown chart shows the amount of work completed each day of the sprint. Based on the rate of story point completion, you can calculate the whether or not the team is on track to complete stories by the end of the sprint.
The following chart is an example of a burndown. The number of story points to complete is on the y-axis. The number of days remaining in the sprint is on the x-axis. When the actual work line remains above the planned work line, the chart indicates that the team is behind schedule. When the actual work line dips below the planned work line, the team is ahead of schedule.
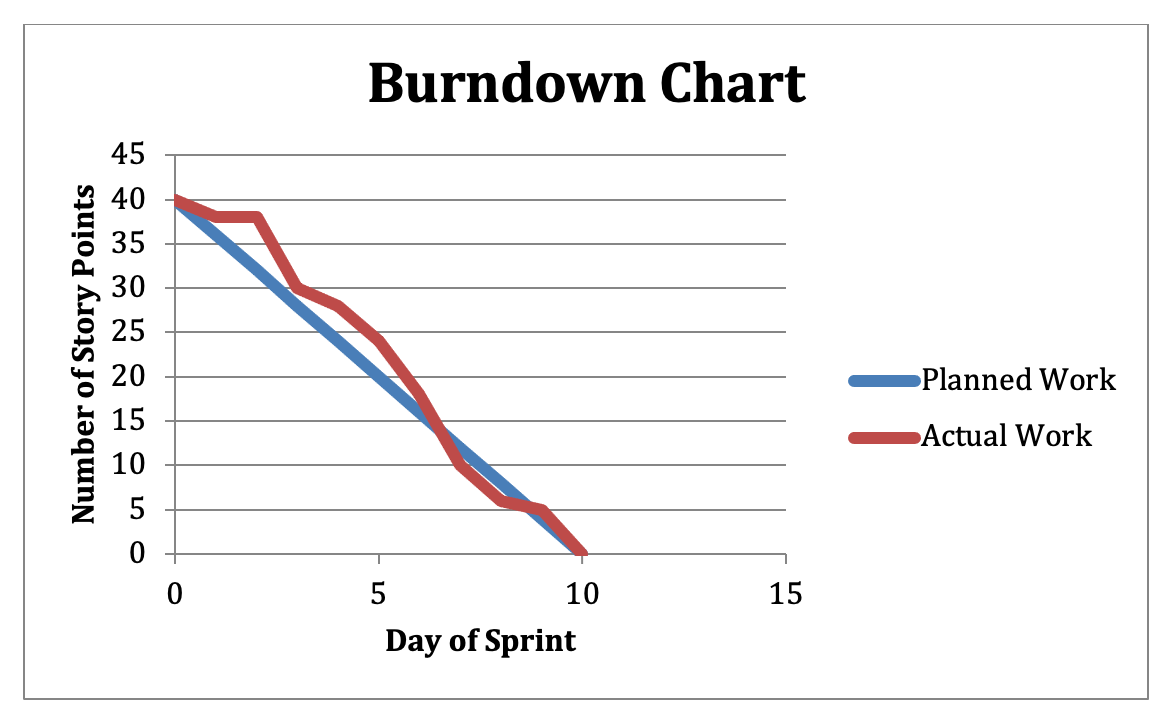
If the burndown chart shows that all of the work is getting completed before the end of the sprint, the team is not planning enough work or is not estimating the stories appropriately. If the team is overcommitting, the actual work line will not be at zero by the end of the sprint.
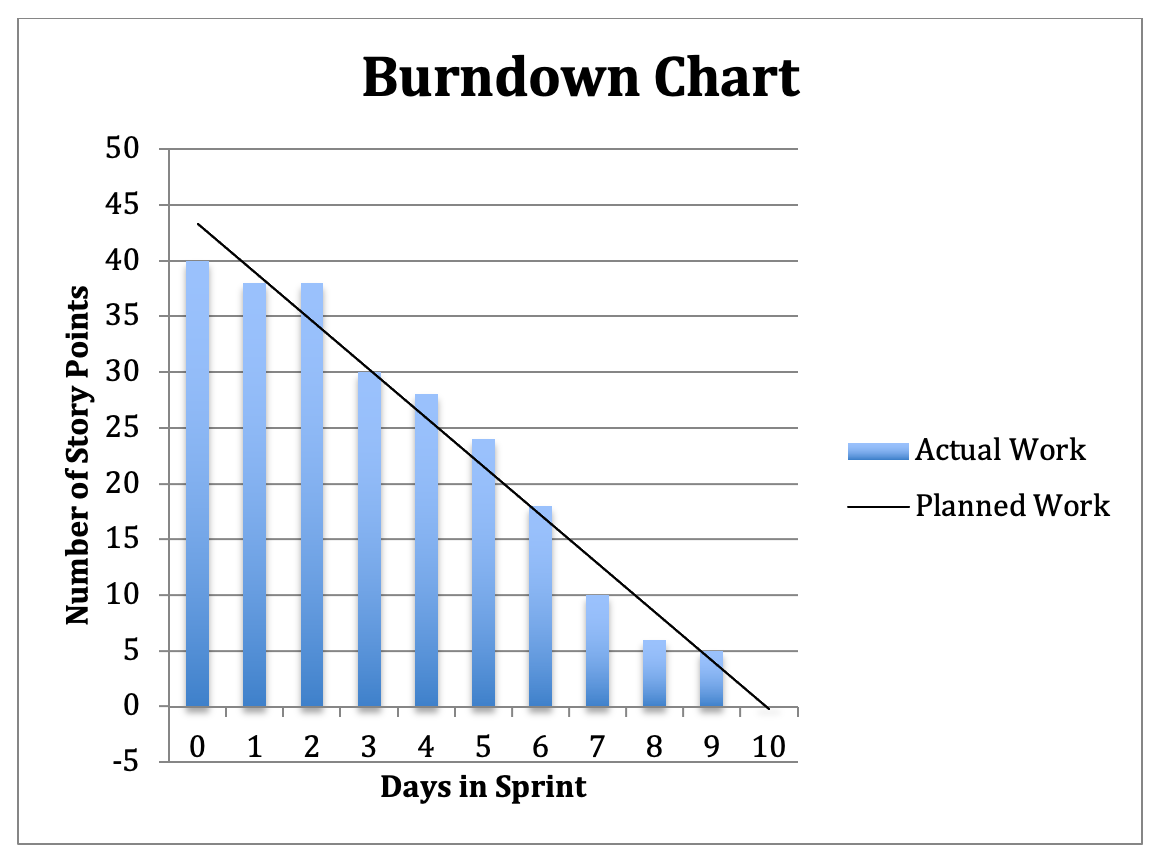
A burndown chart can also be represented as a bar graph.